|
Modeling and ex ante forecasting of a National Economy.
Self-organization of dynamic, interdependent systems.
|
|
Description:
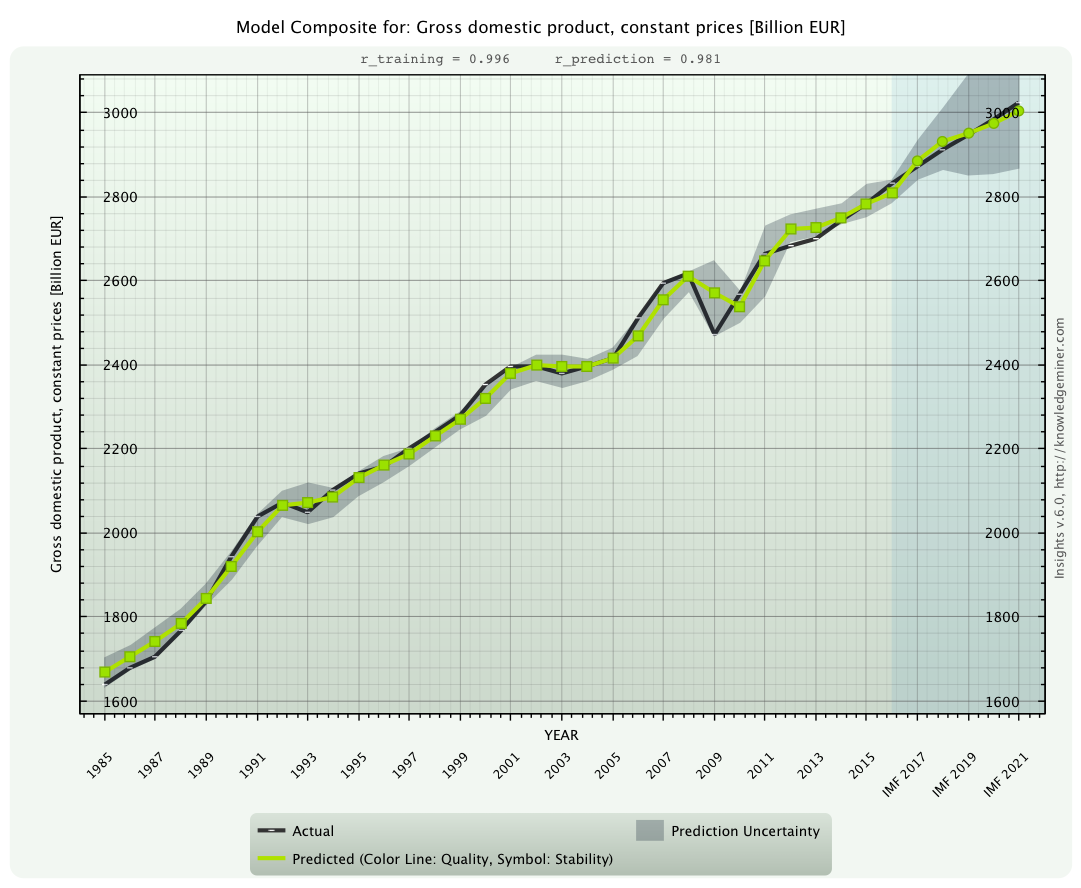
In economic and financial research analysis of economic systems and multi-step ex ante forecasting of key economic parameters are gaining importance. The purpose of such studies is to create preconditions appropriated for expected future developments and to find the laws and factors of influence causing these developments. This example demonstrates the power and results of self-organizing modeling and identification of the interdependence structure of 14 key parameters of the German national economy. Read more ...
Data set dimensions:
Number of system variables: 14 (13 endogenous and 1 exogenous variable)
Number of inputs: 84 (lagged and non-lagged)
Number of samples: 37 (1980 - 2016)
(Note, this is a so-called under-determined modeling problem, where the number of inputs is larger than the number of samples, which cannot be solved by statistical, econometric, or most other data mining and machine learning tools.)
Example of a model equation self-organized by Insights:
x4(t) = 0.00136263x5(t) - 0.0006133768x5(t-1) - 0.0007974957x5(t-3) - 0.9018034x12(t) - 0.5752203x13(t) +
+ 1.256526x14(t-1) - 0.5413245x14(t-3) - 32.00273

Ex ante forecast of the gross domestic product for the years 2017 to 2021 (green dots) along with forecasting uncertainty (gray area)
compared to the IMF forecast (black line).
|
|
Gene Expression Tumor Tissue.
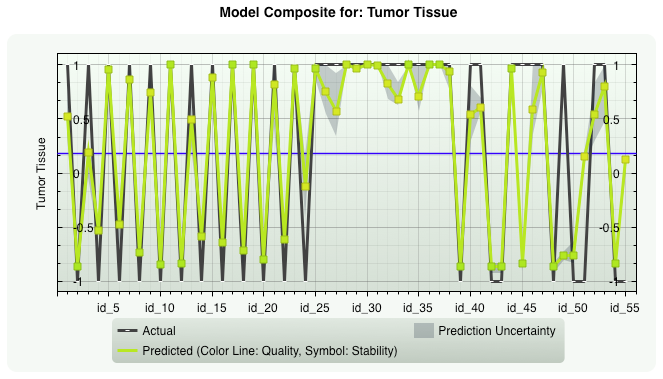
Cost-sensitive Modeling from high-dimensional inputs space (2000 inputs).
|
|
Description:
The data set contains the expression of the 2000 genes with highest minimal intensity across the 62 tissues.
The genes are placed in order of descending minimal intensity. Each entry in the data is a gene intensity derived from the ~20 feature
pairs that correspond to the gene on the chip, derived from a certain filtering process. The data is otherwise unprocessed
(for example it has not been normalized by the mean intensity of each experiment). More info can be found here:
http://genomics-pubs.princeton.edu/oncology/affydata/index.html
Data set dimensions: Number of inputs: 2000 Number of samples: 55 (+7 samples for prediction)
Prevalence: 63.6%
Example of a model equation self-organized by Insights:
X2 = 2,05158 * exp(-(V2^2)) - 0,832151
V2 = 0,000672197X14 - 0,000355077X16 - 0,00318527X379 + 0,000664231X393 - 0,843771
|

|
|
|
Network Intrusion Detection - The Problem of Rare Events.
Cost-sensitive Modeling from highly imbalanced classes.
|
|
Description:
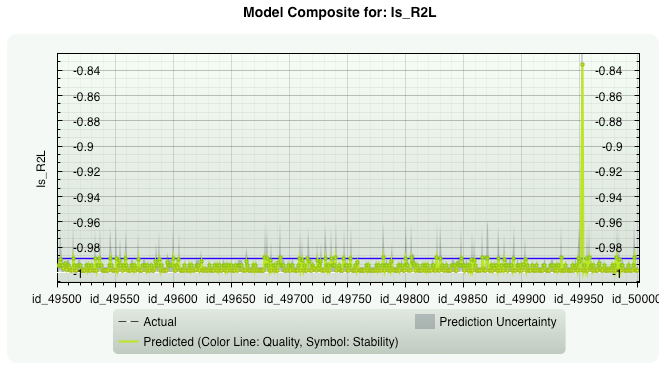
This data set is from the early years of Knowledge Discovery (KDD)/Data Mining, and it is representative for all security and other problems that deal with rare events.
The intrusion detector learning task is to build a predictive model (i.e. a classifier) capable of distinguishing between "bad" connections, called intrusions or attacks, and "good"
normal connections.
The 1998 DARPA Intrusion Detection Evaluation Program was prepared and managed by MIT Lincoln Labs. The objective was to survey and evaluate research in intrusion
detection. A standard set of data to be audited, which includes a wide variety of intrusions simulated in a military network environment, was provided. The 1999 KDD intrusion detection
contest uses a version of this dataset.
Lincoln Labs set up an environment to acquire nine weeks of raw TCP dump data for a local-area network (LAN) simulating a typical U.S. Air Force LAN.
They operated the LAN as if it were a true Air Force environment, but peppered it with multiple attacks.
The raw training data was about four gigabytes of compressed binary TCP dump data from seven weeks of network traffic. This was processed into about five million connection records.
A connection is a sequence of TCP packets starting and ending at some well defined times, between which data flows to and from a source IP address to a target IP address under some well
defined protocol. Each connection is labeled as either normal, or as an attack, with exactly one specific attack type. Attacks fall into four main categories:
- R2L: unauthorized access from a remote machine, e.g. guessing password;
- U2R: unauthorized access to local superuser (root) privileges, e.g., various "buffer overflow" attacks;
- probing: surveillance and other probing, e.g., port scanning.
Read more: http://kdd.ics.uci.edu/databases/kddcup99/task.html.
The Problem of Rare Events.
For data sets with highly imbalanced class distributions of prevalence lower than 1%, already, discriminating between positive (good) and negative (bad) cases starts getting practically and efficiently unresolvable
without not accepting exceptional high misclassification costs. It is clear that for prevalences p = 1% one gets a 99% classification accuracy by simply predicting all and every cases as negative, for p = 0.01%
the accuracy is an amazing 99.99%. To have a chance to identify also positive cases here, the misclassification costs of false negatives must be up to 10,000 times higher than those of false positive cases. This naturally
and intentionally (because FN costs have been increased) leads to significantly more false positives (if the model is not improbably 100% accurate). For an assumed specificity of now 95%, a sensitivity of 50% (which both are good, hard to obtain values) and a population of 100 Million, for example, this results in nearly
5 Million false positive cases (suspicious events) while 5,000 of the 10,000 actual threats are identified. This means, to filter out 5,000 threats one has to accept (and handle) 5 Million cases which are falsely under suspicion,
while the problem of discriminating positive from negative events basically remains (now 5,000 out of 5 Million) and the predictive power of such a model is at the same time very low (PPV = 0.1%; probability that an identified positive event is actually true)
and classification accuracy decreases from 99.99% to 95%. This
situation worsens even more for p < 0.01% and when also taking the effort costs and the consequences of false positive classifications into account, i.e., when making an overall and strict cost-benefit analysis.
Data set dimensions: Number of inputs: 37 Number of samples: 50 000 (+10k samples for prediction)
Prevalence: from 75.1% to 0.004%
Example of a model equation self-organized by Insights:
X42 = 93,3403 * exp(-(V42^2)) - 1,13979
V42 = -0,000194724X29 - 2,49948
|

|
|
|
Forecast of Monthly Global Temperatures.
Dynamic Systems Modeling from High-dimensional Input Space.
|
|
Description:
This model describes a non-linear dynamic system of the atmosphere consisting of 5 micro-drivers: Ozone concentration,
aerosols, radiative cloud fraction, and global mean temperature as endogenous variables and sun activity as exogenous variable of the system.
This is a CO2-free prediction model.
The model was built from up to 1000 input variables with time lags of up to 120 months, which is a typical input space dimension for complex dynamic systems modeling.
Read more...
Data set dimensions: Number of inputs: up to 1000 Number of samples: 404
Time Lags: up to 120 months
Example of a model equation self-organized by Insights:
X4(t) = 0,0337196659X3(t) + 0,0700270364X3(t-10) - 0,071148269X6(t-20) - 1,724442899E-4X3(t-14)X5(t-20) +
3,2971541706E-4X3(t-20)X3(t-20) + 285,76062396
|

|
|
|
|
|

 INSIGHTS
