

|
Why do I need a model?
Models form the basis of decisions.
|
|
Today, Data Mining is mostly recognized as the process of collecting and analyzing amounts of personal data of customers and
people for different purposes by an increasing number of companies, governments and public services. However, Data Mining or better its next generation, Knowledge Mining,
is much more than this and can be much more useful in various problem fields. It can be very helpful, valuable, and even sometimes an unavoidable tool for finding
solutions and getting insights into many real-world processes.
Humans have for centuries been seeking proxies for real processes. A substitute that can generate reliable information about a real system and its behaviour is called a model and they form the basis for any decision. It is worth building models to aid decision making, because models make it possible to:
|
The world around us is getting more complex, more interdependent, more connected and global.
Uncertainty and vagueness, coupled with rapid developments radically affect humanity. Though we observe these effects,
we most often do not understand the consequences of any actions, the dynamics involved and the inter-dependencies of
real-world systems in which system variables are dynamically related to many others, and where it is usually difficult
to differentiate which are the causes and which are the effects.
There are many cases in practice where it is impossible to create analytical models using classical theoretical systems analysis or common statistical methods since there is incomplete knowledge of the processes involved. Environmental, medical and socio-economic systems are but three examples. In contrast, inductive models obtained by knowledge mining are derived from real physical data and represent the relationships implicit within the system without or with only little knowledge of the physical processes or mechanisms involved. There are a lot of complex problems, which do need decision-making, but the means - the models - for understanding, predicting, simulating, and where possible controlling such systems are simply missing increasingly, because we only have insufficient knowledge to follow theoretical modeling approaches. A more powerful and easy-to-use tool that fills this knowledge gap is inductive self-organizing modeling as implemented in Insights. |

|
Self-organizing Modeling.
Discover new knowledge. Gain insights.
|
Self-organizing modeling extracts the information and knowledge
necessary to build up a model from the provided data, only. It therefore transforms information into knowledge.
It is based on the principle of induction which is composed of these three ideas:
|
undergo self-organization if identification emerges through the system's environment. This approach developed by A.G. Ivakhnenko is considered today as one of the first implementations of so-called Deep Learning.
Insights implements a unique and original solution of multi-level inductive self-organization to accomplish the task of modeling for various problems and purposes easily, objectively, and autonomously. In other words, without being an expert in modeling or data mining, using Insights, from your data, you are able to build reliable, validated, not overfitted, analytical models composed of self-selected relevant input variables, automatically. This has never been easier before. Be more productive, more aware, more prepared, more informed, more competitive, and more educated by using predictive models in your problem domain. Update your models as you have new data available with the same ease-of-use and speed of model building. Read more... |
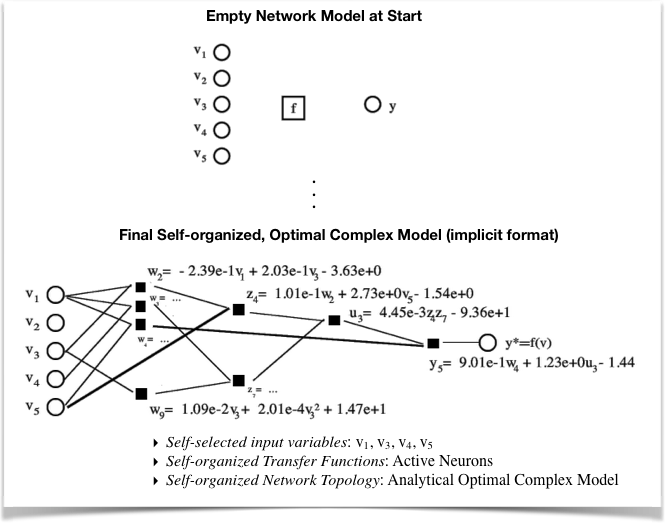
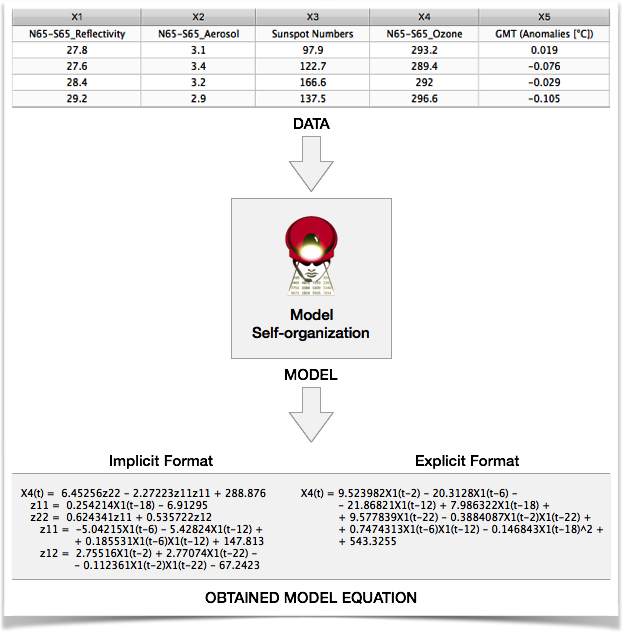
Self-organization of optimal complex models from data in Insights along with analytical descriptions in implicit and explicit format.

|
Interdependent Systems of Equations. 
Ex ante forecasting made easy.
|
| Real-world systems are described by a number of system parameters. The atmosphere, for example, consists of nitrogen, oxygen, ozone, aerosols, water vapor, CO2 and other substances and is influenced by the oceans and cosmic forces like sun irradiance. These system parameters of the atmosphere can be divided into internal state (endogenous) variables of the system and external (exogenous) variables such as the influence of the sun. | Endogenous and exogenous variables can be treated differently for modeling, and the endogenous parameters depend one from another at time t and/or at certain times t-n in history (lags) so that they build a complex interdependence structure of the system. Linear, time invariant, dynamic systems can be described mathematically as systems of algebraic or difference equations as follows: |
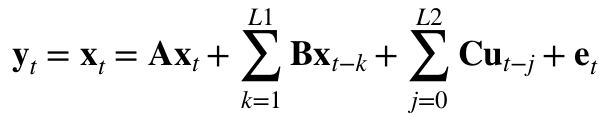
with x - endogenous variables, u - exogenous variables, e - error vector, t - time, and L1, L2 - max. time lags (memory).
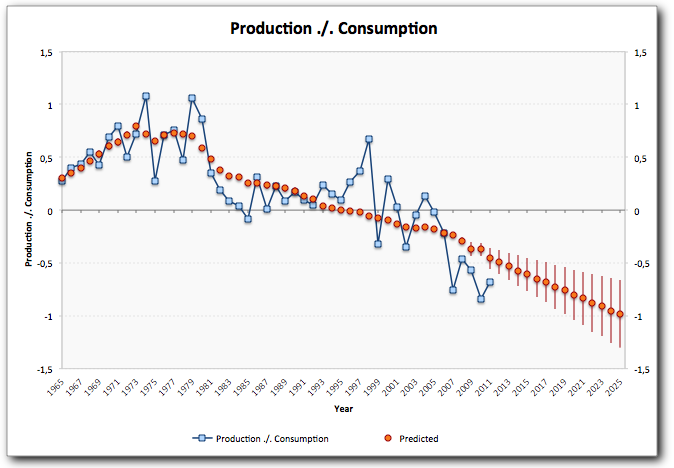
| Models described only by the second term of the formula are also known as vector auto-regressive models (VAR) in various fields as a subset of complete systems of equations. | Due to the interconnectivity of the system variables one advantage of systems of equations in Insights is that they are ready-to-use for multi-step ex ante forecasting for both linear and non-linear systems. Example... |
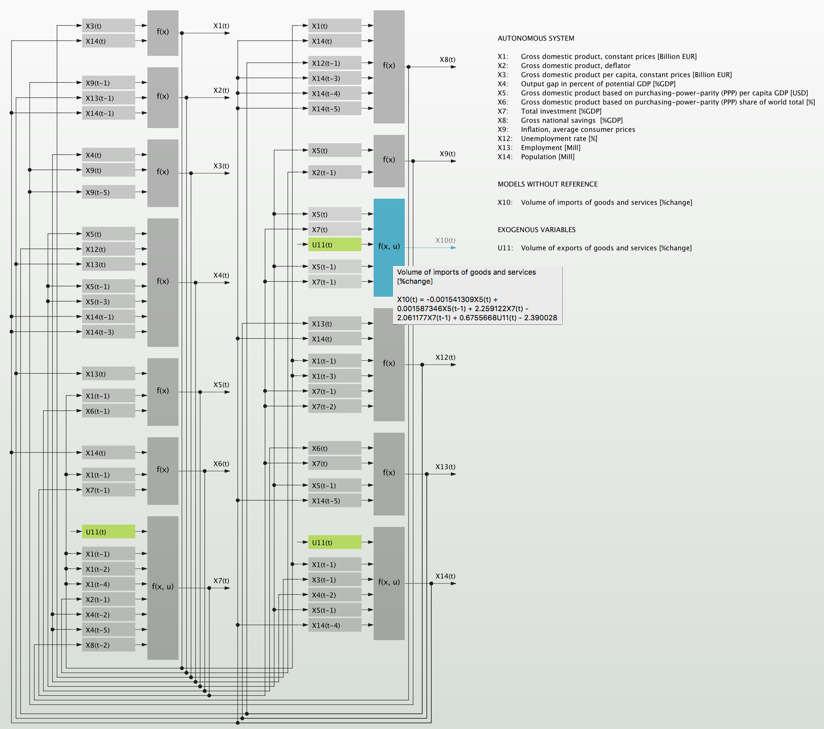
Example: Self-organized interdependent system of equations for a national economy ready for multi-step ex ante forecasting.

|
Similar Patterns and Autoupdating Forecasts.
Forecast complex time processes easily.
|
|
Complex, fuzzy, or very noisy processes are very hard to model and predict by known parametric modeling and data
mining technologies. According to Stafford Beer's adequacy law, a process or object can only be described successfully if the
modeling method used is adequate to the process it describes in terms of its formalization power or language. Simple or deterministic
processes can be described by deterministic modeling approaches, fuzzy processes need a more fuzzy explanation by models.
This is where Similar Patterns self-organizing modeling technology comes in. Similar Patterns - which is also known as Analog Complexing - can be seen as a sequential pattern recognition method that predicts and qualitatively explains fuzzy processes inherently. This method is based on the assumption that every most recent period of time (reference pattern) of a given multi-dimensional time process has one ore more analogous periods in history (similar patterns). If so, a forecast of the reference pattern can be obtained by transforming the known continuations of the similar patterns in history into continuations of the present state of the process. This means the observed |
process itself is used to forecast its most recent state by a nonparametric approach.
The Similar Patterns method implemented in Insights has been enhanced by an inductive, self-organizing modeling approach and by an advanced selection procedure to make it applicable to evolutionary (non-stationary) time processes, too. Use this unique modeling technology to forecast complex and very noisy time processes such as market prices, market demand, or sales figures instantly and with almost no efforts. Optimize the similar patterns composite manually or automatically to get improved or more reasonable forecasts. Once you have generated a Similar Patterns model you can update it on new data stored in Excel via the Autoupdate function of Insights, automatically. Run simulations on historical data continuously for backtesting your model, for example, or use it on real-time data for instant forecasting. All results are reported back and stored in Excel for further application.
A number of examples is included in the |
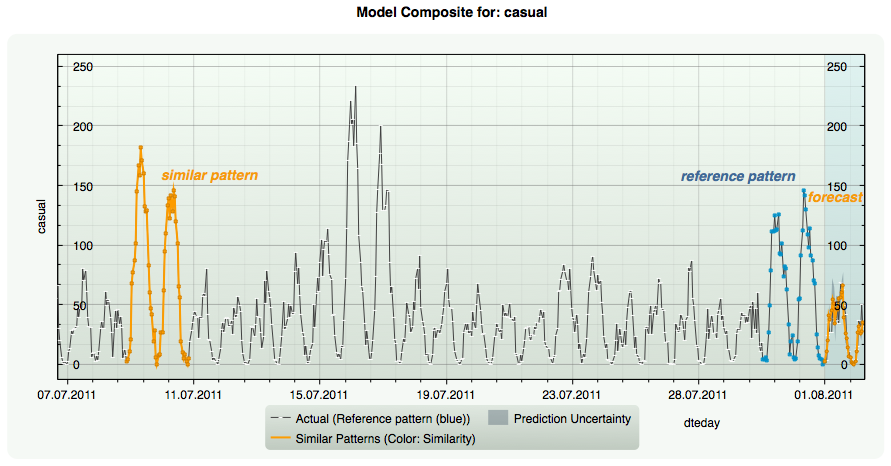
Example: Forecasting bike sharing activity by similar patterns 30 hours ahead.
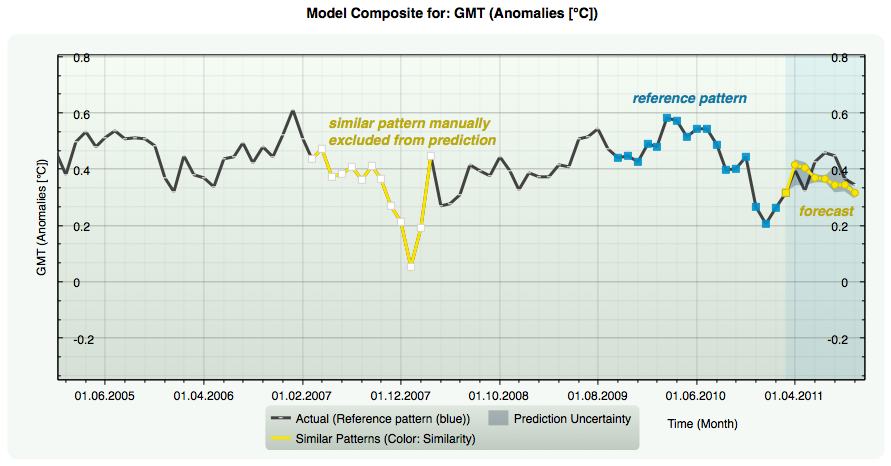
Example: Manually excluding a similar pattern (white squares) from the pattern composite for forecasting.
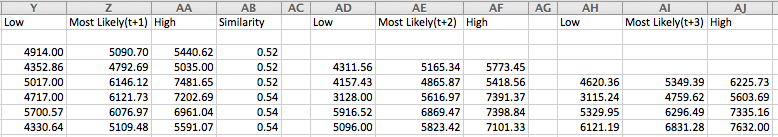
Example: Autoupdating of Similar Patterns models. Forecast intervals of up to 5-steps-ahead forecasts are reported to Excel.

|
Multi-level Model Validation.
Innovation for reliable predictive models.
|
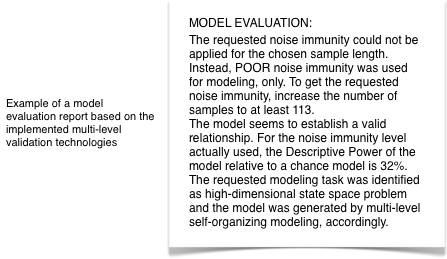
| Obtaining a model from data is easy. Obtaining a model from data that reliably reflects the underlying relationship in the data with some certainty is hard work. This is especially true for noisy, disturbed data. Noisy data are everywhere so you most probably will use them. To systematically avoid overfitting - that is, when the model fits to random cases (noise) and therefore can only have poor predictive power, which makes the model useless -, to get optimized transfer | functions in Active Neurons, and to self-organize robust optimal complex models with optimal predictive power, Insights employs original concepts of model validation at different levels of the self-organizing modeling process. Together with our Live Prediction Validation, application of data mining models is now more reliable, stable, and valuable than ever before. Read more... |

|
Composite Models and Model Uncertainty.
Do not believe a single model. Reality is fuzzy.
|
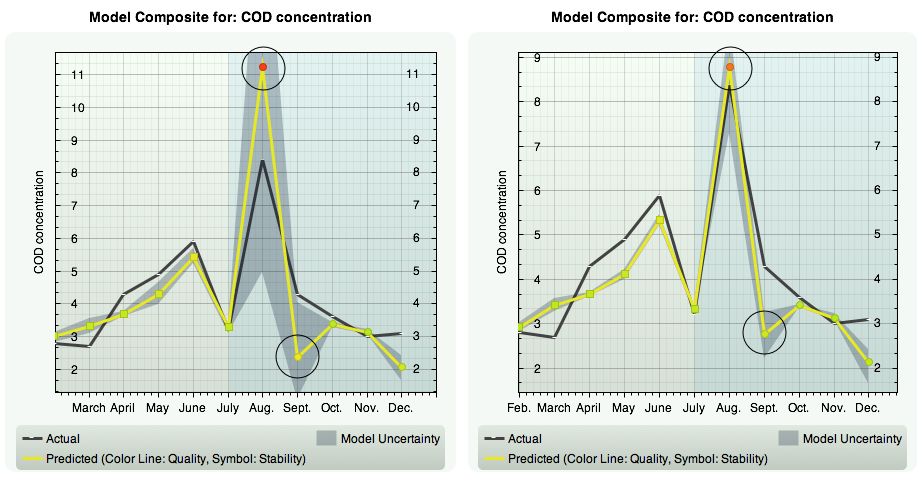
| Any single model describes reality incomplete. On the other hand, by principle in modeling, there is always a set of models that show comparable model performance with respect to a certain quality criterion such as closeness-of-fit but that use different input variables and different model descriptions. So why prefer one model against the other ones and use just this one? More advantaguous and valuable is grouping a set of models into a composite model or model ensemble. Composite models describe reality more thoroughly, | increase the prediction accuracy of the composite, and provide a case-by-case prediction interval or prediction uncertainty by low, high, and most likely prediction values. This also opens up the path to what-if scenarios. In KnowledgeMiner Insights modeling always results in a model composite of most appropriate individual models. You use a composite as you use any single model. Exclude, re-insert or delete a model from the composite and optimize the power and behavior of the composite. |
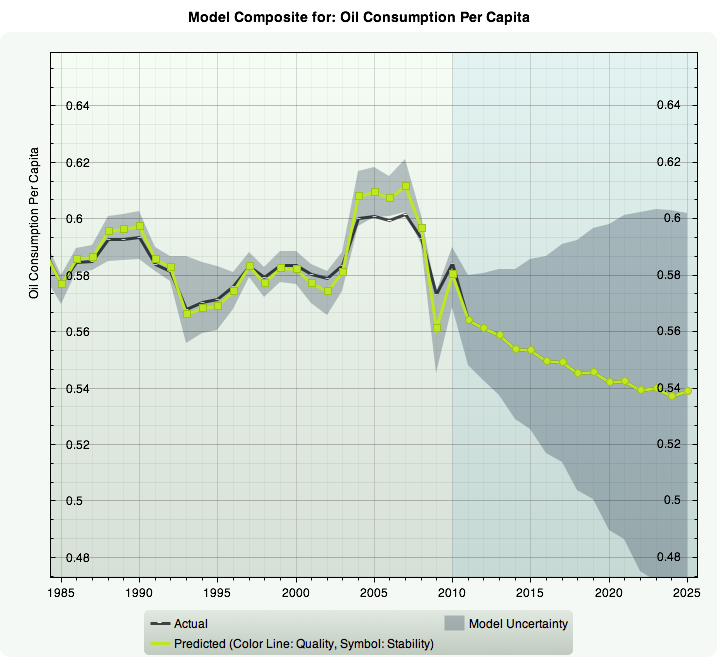
Example: Model uncertainty and prediction interval
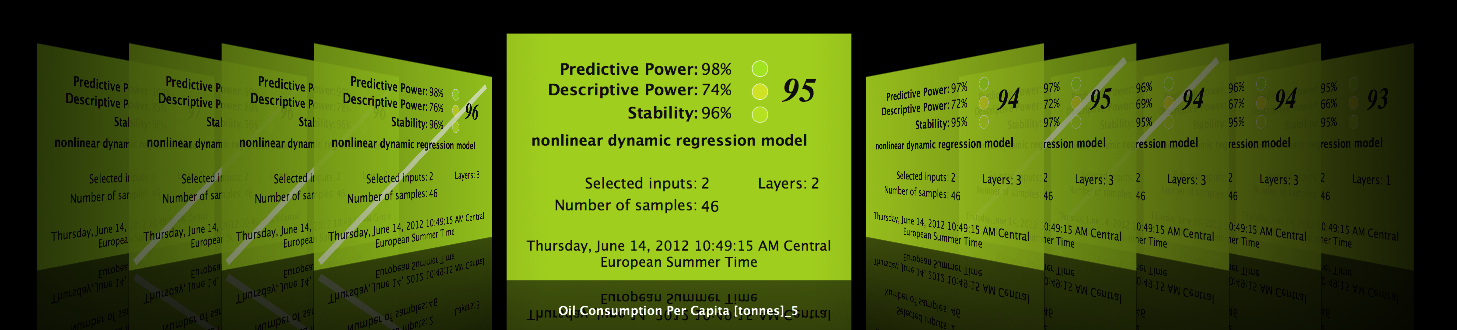
Example: Individual models of a composite with models excluded from prediction calculation

|
Live Prediction Validation.
A missing key feature in data mining. Available here.
|
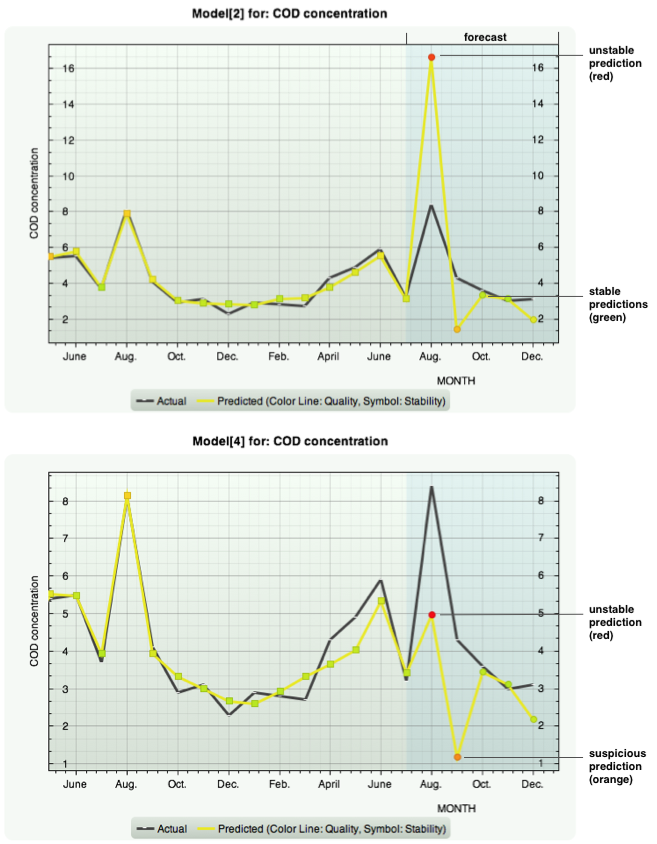
| Until today, in data mining, model validation ends where modeling finishes. The model is then applied in real processes for prediction, classification, recommendation, diagnosis as if it would work stable and correct under all circumstances. But by far, it actually does not. Data mining models are always built on a finite set of data with certain properties. Therefore, like any model, they reflect the underlying object or process incomplete and approximately, only. Their validity is limited in space and/or time which defines their actual applicability domain. | If a model works in its applicability domain or not only depends on the input data given to the model at runtime to predict an outcome. If a model works outside its domain it gets instable with irregular and presumably false prediction. How can a prediction respectively model be used with good conscience if there is no indication if it is applicable at all to the given inputs? The situation that a model works outside its applicability domain is not exceptional but can happen very often, especially for nonlinear models which are common in data mining. |
| Insights calculates a model stability value for each prediction indicating if the model works in its applicability domain, be it in-sample (training data) or out-of-sample (forecast). This value is shown in the plots by a corresponding symbol color. |
|
| We at KnowledgeMiner Software have taken this problem serious and we are proud that we came up with a powerful, original solution that makes model application in KnowledgeMiner Insights much more trustworthy. | For every single prediction you calculate, you also get the information if and to which extent the model is working in its domain. This makes further use of the prediction in your decision process safer and more robust. |

|
Cost-sensitive Modeling.
Get tailored, purpose-driven classification models.
|
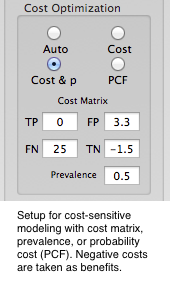
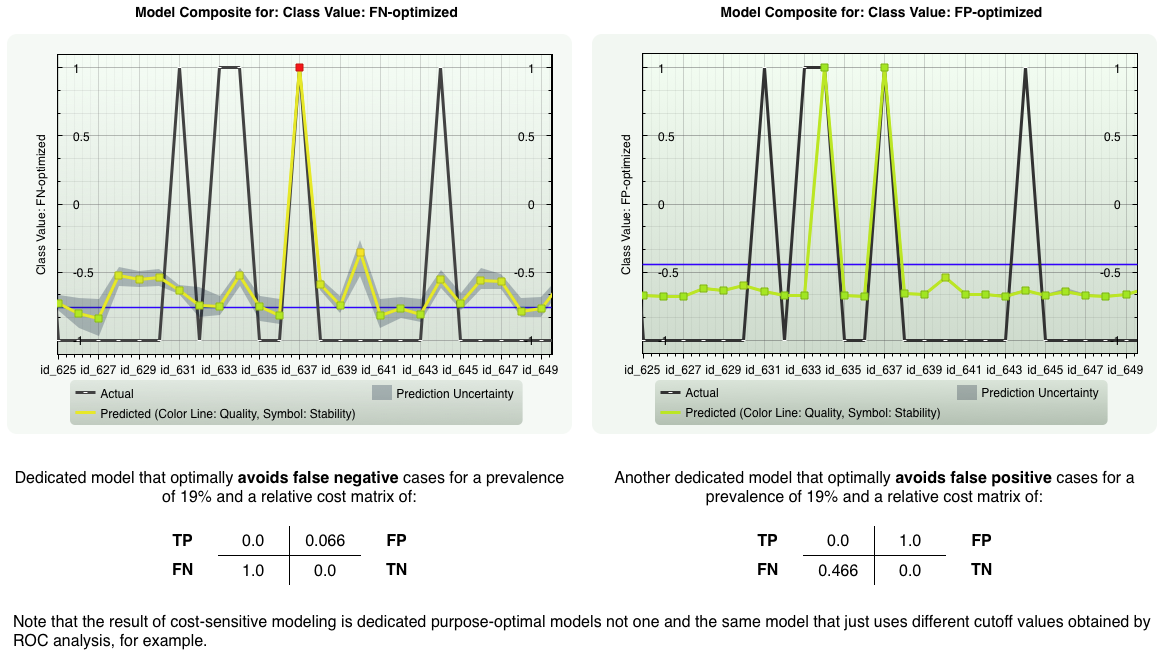
| Commonly, binary classification tools require that the number of positive and negative cases in a data sample are of nearly equal size, i.e., a prevalence of about 50%, and that the misclassification costs for false positives and false negatives are also equal. The same is true for the benefits of true positives and true negatives. These three assumptions, however, are not fulfilled for most real-world problems. Imagine a medical disease diagnosis problem. It is intuitively clear that the number of persons of a whole population who have the disease is essentially smaller than those who doesn't. Here, prevalence is very small. Also, the costs (personal, medical, societal) of diagnosing a healthy person sick are quite different from the costs of diagnosing a sick person healthy - depending on the disease, but also on the purpose of the diagnosis: is it a first screening or a final test, for example. | This means, classification accuracy alone isn't what you are interested in. First of all, it is the cost that has to be minimized. Another example from marketing: if you run a campaign you are mostly interested to reach all active customers which most likely will place an order and therefore would accept a certain number of false positives. What you need here again is a tailored model according to your actual active-to-all customers ratio (prevalence) and the costs and benefits of falsely respectively correctly identified customers associated to this specific campaign. Insights provides exactly this capability in an intuitive and simple way: define the costs and prevalence of the problem or let Insights use appropriate values automatically and come up with a dedicated, cost-optimized predictive classification model you can deploy in Excel, for example, immediately. |
|
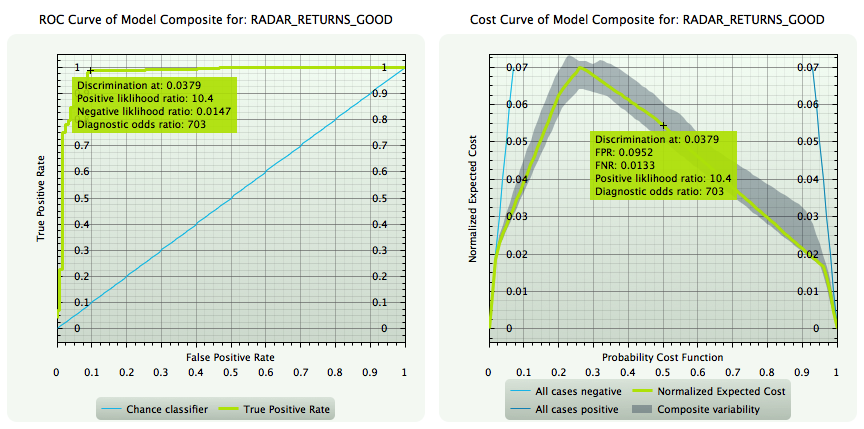
| For binary classification models, Insights generates ROC and Cost Curve plots as powerful and complementary tools for performance analysis and optimization of classification measures according to the intended task of the model. |

|
High-dimensional Modeling.
Real world is complex. Complexity is high-dimensional.
|
| Don't care about dimensionality of your data sets any longer. High-dimensional modeling in Insights scales not only to data sets of very small (< 20) to large number of samples but also from small to very large number of potential input variables (up to 50,000). You simply self-organize models from data directly. | This applies even for so-called under-determined modeling tasks, i.e., when the number of data samples is smaller than the number of input variables. Insights ensures that the appropriate modeling and noise filtering algorithm is used to get reliable and compact predictive model composits. |
Common modeling technologies and their applicability to different data set dimensions.
| Sample Size n |
Small number of inputs m (m < 50) |
Medium number of inputs m (49 < m < 500) |
Large number of inputs m (499 < m < 50K) |
| Very Small (n < 30) | I, [R] | I | I |
|---|---|---|---|
| Small (29 < n < 200) | I, [R, ML] | I, [R] | I |
| Medium (199 < n < 10K) | I, R, ML | I, [R, ML] | I |
| Large (10K < n < 1M) | I, R, ML | I, [R, ML] | I |
|
ML - Neural Networks, Support Vector Machines, and other Machine Learning methods. R - Statistical regression methods. I - Self-organizing high-dimensional modeling with KnowledgeMiner Insights. [.] - Can be applied under certain conditions only. |

|
64-bit Parallel Software.
Use the full power of your Mac.
|
|
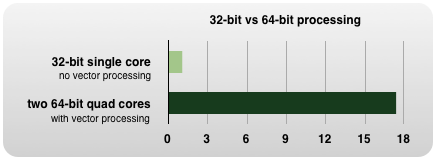
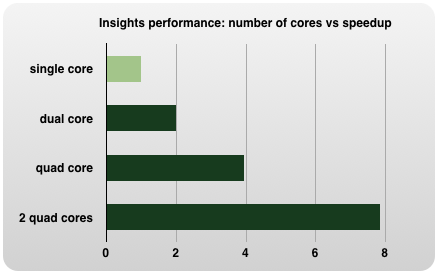
Insights implements vector processing, multi-core and multi-processor support for high-performance computing.
It scales to the hardware of your Mac. No matter if you use a dual-core machine or a Mac with two 6-core
processors, you always take full advantage the power of your hardware. Automatically and free.
|
|

|
Excel Support.
Exchange data and use your models in Excel.
|
| Import your data from Excel right away into Insights by a single mouse click. This is the most convenient and fast way to start modeling from your data. But also the reverse way works: Export your developed models and selected input data to Excel | and further use them in your favorite way. No matter if it is a single model or a model composite you also can have Insights generating related plots for you. Employ your models in Excel with no additional effort. |
Example: Auto-generated plot in Excel for a composite model.
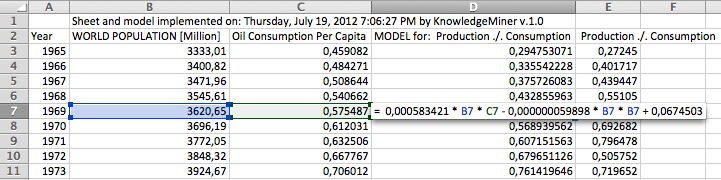
Example: Implemented single model in Excel.
|
|
Model Export.
Integrate models in your projects or workflows.
|
| Once a model is generated in Insights you may not only want to use it within the app but also to integrate it into web applications or other projects directly. No matter if you implement a fully working model ensemble in Excel, Python, Objective-C or AppleScript | or if you export it in Text format for further analysis in MATLAB, this powerful and convenient feature provides considerable time and cost savings for applying developed models in different environments and conditions more productively. |
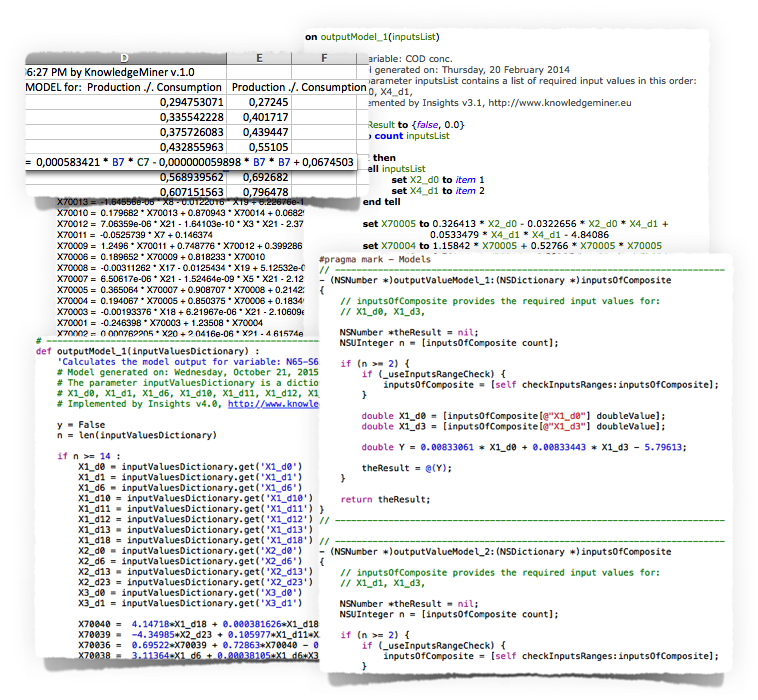
Different export formats for both individual and ensemble models: Excel, AppleScript, Text/MATLAB, Python, and Objective-C.

|
Try out free.
Start using the value of your data today.
|
