
|
Papers.
A New View on What Drives Climate on Earth in the Long Run.
|
|
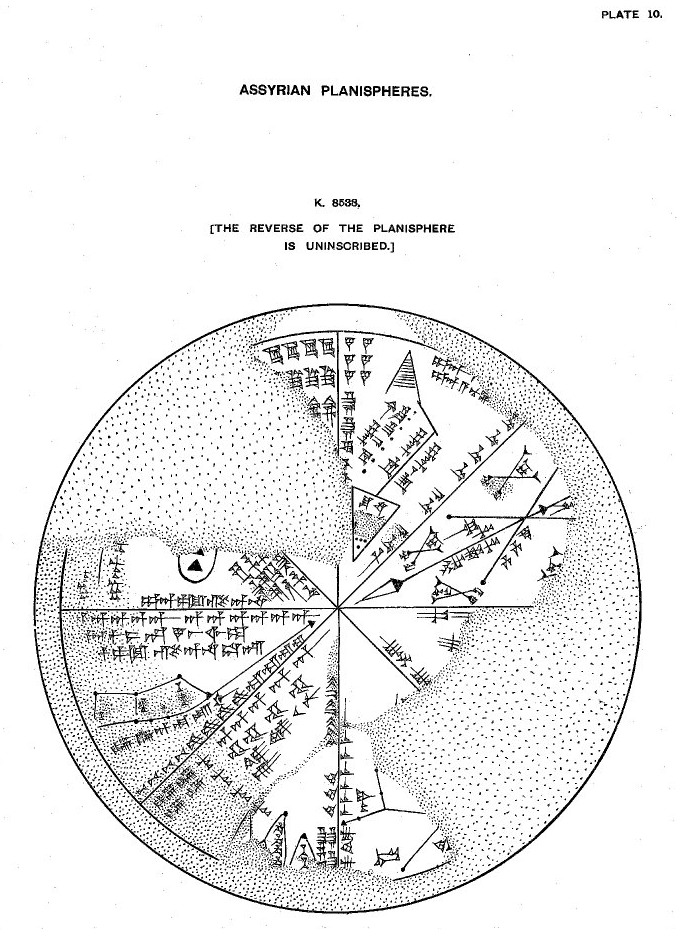
The Sumerian K8538 tablet. The great meteor impact devastating Mesopotamia - a 2019 translation addendum
By Joachim Seifert and Frank Lemke
Published: February 18, 2019 Full Paper |
media: image (677 x 930 px) download |
|
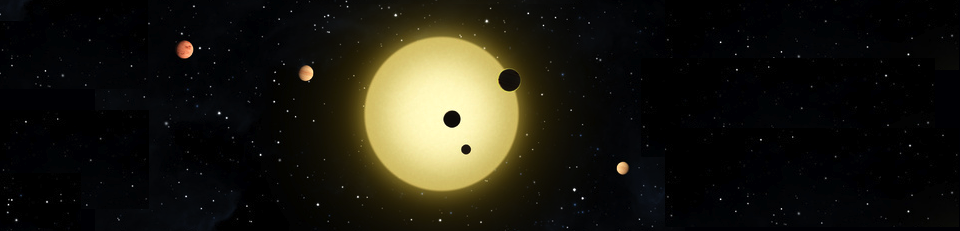
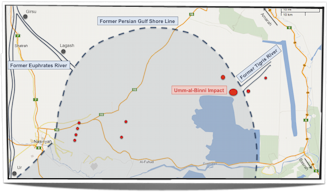
Abstract The paper adds new translation knowledge to our 2014 paper “The Sumerian K8538 tablet - The great meteor impact devastating Mesopotamia”. We present an improved, detailed fixing of the meteor impact day and impact hour, according to data provided on the tablet. A sky map for Northern Taurids meteor showers shows the comet flight path in the sky. Other useful information is given concerning climatic change, following the meteor impact, the meteor impact aftermath and new details for the relation of the cosmic impact to the Christian Bible, in particularly to Genesis and Apocalypse. The meteor impact occurred at 10:56 am, on September 22, 2193 BC, after the meteor emerged at 5:34 am at dawn and after a flight time of 5 hours 22 minutes. These numbers can clearly be deduced out of observation data entries in the tablet’s pictographic records and in comparison to LOD (length-of-day tables) for the corresponding Mesopotamian latitude. The K8538 tablet is property of the British Museum. Unfortunately, the museum is staunched in its opinion that this tablet represents the Babylonian sky as a so-called “planisphere”. This opinion is based on an interpretation, which we, for the first time, analyze in comprehensive detail, item by item, in this paper. Result: The planispheric concept of the Babylonian sky on this tablet is a hoax: Not one single correct argument proves alleged recorded planispheric constellations on the tablet, except one, already found by L. W. King, over 100 years ago, back in 1912. As translated in our 2014 K8538 paper, the tablet has never been a planisphere, but is a pictographic “cartoon” story, probably the first recorded cartoon of the world, consisting of a sequence of 8 subsequent pictures, to be turned while reading, to advance the story. All 8 pictures exclusively show observations, recorded measurements and specific details of flight and impact of this disastrous meteor, which destroyed the nearby Akkadian capital in Mesopotamia. Because Southern Iraq in the impact area was swamp and marshland until recently, an exploration of the discovered impact crater, Umm-al-Binni, was impossible. For the first time, it is feasible from 2019 on, and a first crater inspection will soon be conducted. Due to missing explorations of the impact crater, Near-East historians, until now, did not recognize the historical cosmic impact event, but we may expect that this will change in the near future.
|
|
Holocene Climate Pattern Recognition Paper Series
|
|
Abstract of the Holocene paper series Features and application of the Climate Pattern Recognition method for evaluating
temperature evolution in Holocene time series are explained. This study recognizes four distinct climate patterns:
a multi-millennial pattern, two multi-centennial patterns and one short multi-decadal pattern.
Special attention is given to peak temperature spikes. The analysis is able to distinguish different
causes of climate change out from Holocene temperature graphs, such as the Milankovitch cycle,
Earth orbit oscillations, cosmic meteor impacts on Earth and likely volcano mega-eruptions.
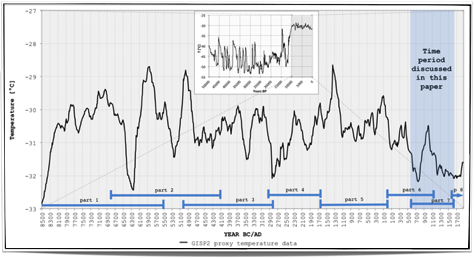
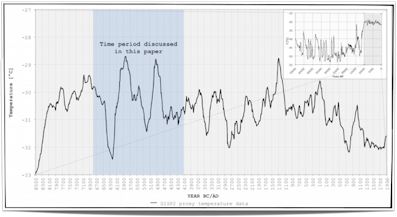
We use the graphical version of the GISP2 data set transformed into equidistant time intervals of 10 years for visual demonstration of climate patterns. Each up and down
of the GISP2 temperature curve is explained in detail. We were able to identify the causes for cyclic
Bond events and causes for other cyclic temperature oscillations in the Holocene. A well-defined
continuous multi-centennial Holocene cycle with 7-year growing periods is proven for the entire Holocene.
Its exact timing of the cycle excludes an internal atmospheric-oceanic cycle cause. The pattern
recognition method determines the indisputable celestial origin of cyclic patterns and is superior
to GCM/PMIP/CMIP models, which all underperformed in recent 2014 model-data comparisons. The entire series contains 8 papers, which will be added successively.
|
|
Climate pattern recognition in the late-to-end Holocene (1600 AD to 2050 AD, part 8).
By Joachim Seifert and Frank Lemke
Published: January 30, 2018 Full Paper (part 8)
|
|
|
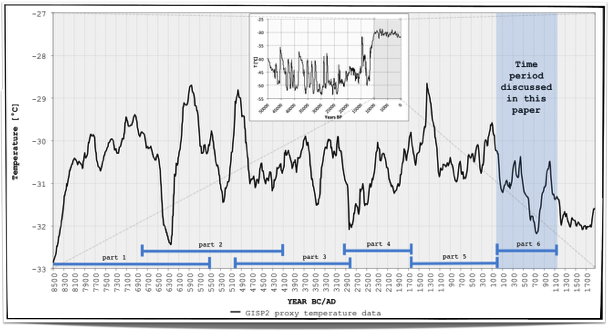
Abstract The time span 1600-2050 AD covers the most recent of a total of 30 cyclic sine half-wave periods, which developed since the beginning of the Holocene. The first half-wave cycle commenced in 8108 BC, with a periodicity of 238 years. This cycle is a growing cycle, which increments by 6.93 years, as all papers of the Holocene Climate Pattern Recognition analysis demonstrate. The present periodicity of the cycle is 439 years long, starting within the Little Ice Age (LIA) temperature bottom trough, 1590 to 1640 AD, at 1610 AD, and rising to the Current Warm Period (CWP) cycle top at 2049 AD. This Holocene paper series additionally serves as a 10,000 year empirical confirmation of astronomical-physical calculations of the cyclic nature of the climate. We showed that well-defined, regular wave periodicities led us out from the 500 BC Homerian Minimum into the Roman Warm Period, into the Late Antique Little Ice Age (LALIA) cold period, then into the Medieval Warm Period (MWP), followed by the cold LIA and now into the present warm CWP with its peak in 2049 AD and, thereafter, into the return of the next cold future “LIA”. As in seven previous recognition papers before, which cover the entire Holocene since 8500 BC, our obligatory pattern recognition grid was placed onto this time span 1600-2050 AD. We provide a comparison of nominal cyclic half-wave temperatures to actual measured GISP2 and GISS temperatures. It is demonstrated that the sine wave motion is modified by pulsations of the 62-year cosmic Solar-Planetary Oscillation (SPO; in previous parts called SIM) cycle (with the Atlantic Multidecadal Oscillation (AMO) and the Pacific Decadal Oscillation (PDO) as two observable oceanic temperature effects), which produces regularly spaced, consistent warm peaks along the entire Holocene. These warm peaks appear since 1818 AD in shapes of 4 upward moving staircase steps. The present staircase temperature peak is 2004 AD, from where on the flat step surface (today known as “The Pause”, “Hiatus”, “Plateau”) will persist until the year 2046 AD. The top of the sine wave temperature cycle is the year 2049 AD, from where on temperatures will enter into the 31st cycle, with a 439+6.93 year descent, until the future “LIA” temperature bottom will be reached. The final paper of this series, part 9, will cover the time span 2000 AD to the End of the Holocene. Such a forecast can be made, because existing five underlying cosmic, astronomical forcing mechanisms of climate change can be calculated.
|
|
Climate pattern recognition in the late-to-end Holocene (550 AD to 1650 AD, part 7).
By Joachim Seifert and Frank Lemke
Published: June 7, 2017 Full Paper (part 7)
|
|
|
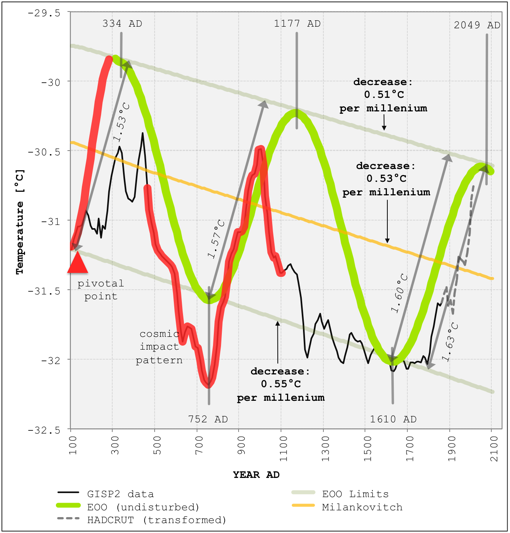
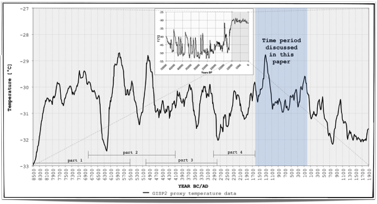
Abstract This 1,100 year time span, 550-1650 AD, consists of four distinct climate pattern periods. Each period shows the prevalence of only one of five existing cosmic climate driving mechanisms. The first distinct period is 550-1050 AD, consisting of a large double spike cosmic meteor impact pattern. The background is that each meteor impact of size leaves this particular pattern imprint within the entire GISP2 time series. The double spike consists of one cold spike at first, to 744 AD, also termed Late Antique Little Ice Age (LALIA), then followed by the second half of this pattern, the warm spike, to 985 AD, the Medieval Warm Period (MWP). This pattern ends after 500 years in 1050 AD. Thereafter, the second pattern sets in: Two clean 62 year Solar Inertial Movement (SIM) patterns in a row; the pattern is generally known by its effect on ocean heating and cooling, as AMO and PDO cycles. Two distinct warm SIM cycle peaks appear in GISP2. The robustness of the 62 year cycle length can be verified by backtracking this exact cycle length over multi-millennia, over more than 100 cycles in line, in the Holocene. The third pattern period starts in 1178 AD, and is caused by a strong cosmic lunar meteor impact. At this date, this impact displaced the Earth-Moon Barycenter (EMB), which then spirals back in 4 complete loops onto its regular EMB flight path around the Sun, for the following 400 years. This steady continuous closing in by four spiral loops onto the normal EMB orbital flight path around the Sun is clearly visible in the GISP2 data between 1207 AD and 1590 AD. The fourth pattern period is the EOO (Earth Orbit Oscillation) with its low temperature trough, 1590-1640 AD, which marks the very bottom of the Little Ice Age (LIA), with a minimum trough temperature of -32.08°C on the GISP2 borehole temperature scale. This minimum trough marks the end of the 29th half-wave Earth Orbital Oscillation (EOO) period, 432 years in length. Those orbital oscillations are growing cycles; they commenced in 8108 BC, with an initial half-wave length of 238 years, growing in succession by 6.93 years per half-wave. Out of the EOO-LIA minimum temperature trough, temperatures are bound to rise for 439 years, to the top of the 30th half-wave, which is the next high temperature peak, in 2049 AD.
|
|
Climate pattern recognition in the late Holocene (1 AD to 1150 AD, part 6).
By Joachim Seifert and Frank Lemke
Published: January 20, 2017 Full Paper (part 6)
|
|
|
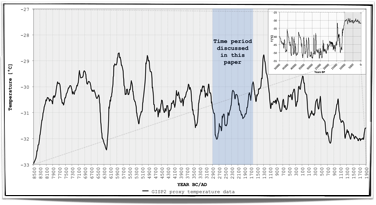
Abstract The pattern grid consists of vertical lines for recurring Earth orbital periodicities, and of three more lines, which are horizontally inclined lines, i.e., the Milankovitch line and the upper and the lower orbital oscillation (EOO) boundary line. The Milankovitch line remained horizontal for six preceding BC millennia, now slowly turning into a descent towards the next glacial. The grid clearly identifies the swivel time span, required for the horizontal Milankovitch line to change into an inclined Milankovitch line with a descent trend of 0.47°C per millennium. The descending secular trend commences right within the first four AD centuries, known as RWP (Roman Warm Period). The RWP consists of twin temperature peaks, one at 115 BC and the second peak at 435 AD. Temperatures, from 435 AD on, start to fall significantly, as demanded by a threefold combination of the descending Milankovitch trend, the descent of the EOO-orbital sine line and of the descending part of the Z-shaped pattern of the 365 AD cosmic meteor impact. At 535-540 AD, additional cooling for two decades can be observed, the effect of the Ilopango volcano mega-eruption in El Salvador. As temperatures from 435 AD on rapidly descended, drought conditions set in, which greatly worsened living conditions on Earth. For this reason, the time after 435 AD is named as Dark Age Cold Period, Vandal Minimum or LALIA (Late Antique Little Ice Age), which led to the demise of a number of civilizations on Earth. In its progressing descent, cooling conditions worsened by two cosmic meteor impacts, Kanmare at 572 AD and Tabban at 680 AD. From the final temperature bottom of 751 AD, a vigorous temperature rebound set in, which is, after previous impact cooling, the second part of the Z-shaped cosmic impact pattern, visible in the GISP2 time series. This temperature rebound in a straight upswing graph line peaked in a high temperature spike, known as the Medieval Warm Period (MWP). This period occurred universally on the planet, because the Z-shaped cooling-warming-cooling pattern after each cosmic meteor impact is a global phenomenon on Earth. From the peak temperature in 1000 AD temperatures fell back to its pre-cosmic impact temperature level of 572-680 AD, now in 1100 AD, after forces of the two cosmic impacts have ultimately expired.
|
|
Climate pattern recognition in the mid-to-late Holocene (1650 BC to 1 AD, part 5).
By Joachim Seifert and Frank Lemke
Published: June 21, 2016 Full Paper (part 5)
|
|
|
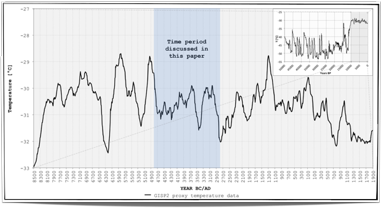
Short Abstract The analyzed time interval contains two major features: A very large cosmic bolide impacting Earth at 1628 BC, which produced as all cosmic impacts a Z-shaped temperature swing. The second feature is the return of the Taurids Stream, which occurs about every 3000 years. Its recognizable characteristics is the bombardment of Earth with a multitude of small-to-medium sized cosmic bolides, producing numerous impact craters on Earth, which is accompanied by small-to-medium sized Z-shaped temperature spikes in the GISP2 record. This Taurids Stream commenced at 1200 BC and lasts 1000 years. We compare this time span to the previous Taurids episode about 3000 years earlier and show the almost identical appearance of both. We identify seven Taurids impacts on Earth, and two unknown impacts are recognizable in the GISP2 temperature graph. The Taurids period is the time with the largest number of cosmic impacts on Earth in fast succession. This cosmic bombardment kept the temperature evolution relatively horizontal over 900 years, by preventing the formation of steep century-long temperature drops.
|
|
Climate pattern recognition in the mid-to-late Holocene (2900 BC to 1650 BC, part 4).
By Joachim Seifert and Frank Lemke
Published: June 10, 2016 Full Paper (part 4)
|
|
|
Short Abstract We analyze each spike of the temperature evolution within this 2900-1650 BC time frame. There are 3 horizontal grid lines, the central line is the Milankovitch line, signifying the GISP2 borehole core temperature, if all other climate drivers were excluded. The two other horizontal lines are the upper and the lower Earth orbital oscillation line, within which the Earth climate varies, if not impacted by large cosmic bolides. As we demonstrate, the Holocene temperature evolution does not remain confined within these upper and lower horizontal lines, because strong cosmic impacts always and necessarily produce a strong temperature down-spin spike, followed by a strong upward temperature rebound spike, regressing thereafter. Large agricultural societies, which developed since 3000 BC, such as in Sumer, Egypt, China and India collapsed. The Sumerian-Akkadian culture with its capital city Agade was wiped off the map by a direct bolide hit. Details of bolide impacts, drought and society demise are provided.
|
|
Climate Pattern Recognition in the Mid-Holocene (4800 BC to 2800 BC, part 3).
By Joachim Seifert and Frank Lemke
Published: May 4, 2015 Full Paper (part 3)
|
|
|
Short Abstract This third Holocene series paper explains the global temperature evolution in the Mid-Holocene. A first major time interval, a millennium epoch of 4700BC - 3700BC, will repeat itself 3000 years later (1200BC - 200BC) as the visible effect of the Taurus Stream onto the Earth´s climate. Another major time frame, 3300BC - 2800BC, reveals the EOO-wave periodicity clearly and well visible. Other, smaller events and forces are described.
|
|
Climate Pattern Recognition over 2700 Years of the Early Holocene (6800 BC to 4100 BC, part 2).
By Joachim Seifert and Frank Lemke
Published: February 10, 2015 Full Paper (part 2)
|
|
|
Short Abstract We determine four major climate drivers, active in the time frame 6800BC to 4100BC. Each Holocene temperature spike is discussed, after placing a reference grid of vertical and horizontal identification lines over the GISP2 temperature evolution. This Early Holocene time span is governed to 90% by two large cosmic meteor impacts, which override and mask the regular EOO-wave line. Two small cosmic impacts govern the course of temperature in 4700BC - 4100BC.
|
|
Climate Pattern Recognition over 3000 Years of the Holocene Onset (8500 BC to 5600 BC, part 1).
By Joachim Seifert and Frank Lemke
Published: revised version, March 19, 2017 (initial release: December 28, 2014) Full Paper (part 1)
|
|
|
Short Abstract Features and application of the Climate Pattern Recognition analysis for evaluating temperature evolution in Holocene time series are explained. We select as the first period, the early 3000 years of the Holocene. This study recognizes three distinct climate patterns, a multi- millennial pattern and two multi-centennial patterns. Special attention is given to peak temperature spikes. The analysis is able to distinguish drivers of climate change from Holocene temperature graphs, such as the celestial Milankovitch motion, Earth orbit oscillations and cosmic meteor impacts on Earth. We use the graphical version of GISP2 for visual demonstration of climate patterns. Each up and down of the GISP2 temperature curve is explained in detail.
|
|
The Sumerian K8538 tablet - The great meteor impact devastating Mesopotamia.
By Joachim Seifert and Frank Lemke
Published: April 25, 2014 (20 pages) Full Paper |
media: image (677 x 930 px) download |
|
Abstract The K8538 is the world's first scientific documentation on approach and terrestrial impact of a large comet on Earth.
Observations were made on top of an astronomical tower, located 100 km close to the impact site. The report is presented in form
of a sequence of eight pictures, explaining the comet's first astronomical sighting, the appearance of comet tail and coma,
the growing comet size, the comet flight across the sky and finally, its visible impact beyond the horizon, i.e. the impact
flash lighting of the sky and the subsequent elevation of ash plumes, glowing beyond the horizon, spreading North and West.
The impact itself is not described as a blast pressure wave but rather as an ash and dust tempest, rising out of mud sediments
from the Tigris and Euphrates river delta, where the hot comet found its burial. The astronomical observer carried out
trigonometrical measurements to record the flight path in the sky, flying distances and flying times. The observer started
his measurements as soon as the comet showed its spectacular size, coma and tail, which convinced the observer, that an
extraordinary celestial event was about to take place. The K8538 is a full comprehensive analysis of the comet event; its
eight-picture sequence is cohesive. The tablet is a masterly work, explaining with as little text a maximum amount of impact
event features. The tablet is a late Babylonian copy of the early old Sumerian original. Written cuneiform signs of two zodiacal
constellations, Orion and Triangulum, are later Babylonian copy scribe additions and were not part of the Sumerian original.
The K8538 tablet had high priority in Babylonian times, because it provided the documented evidence that the comet emerged out
of the constellation Triangulum, Mul-Apin, onto which late Babylonian astronomy and religion rested. The tablet eyewitness
account shows Mul-Apin as celestial seat of Gods and celestial source of destructive meteors on Earth. For this reason, the
K8538 was guarded, copied and refreshed over more than 1,500 years, until the late Babylonian period, after the observed meteor
impact in 2,193 BC. The tablet does not deal with any Babylonian zodiacal astrology. The described cosmic impact on Earth is the
so-called 4.2 kyr event, shown in our other Holocene climate change studies. The comet impact is responsible for a 300 year long
drop in global temperatures combined with lasting mega-droughts, which led to the collapse of various ancient civilizations around the world.
|
|
The destruction of the city of Akkad by a cosmic asteroid impact and the link to global climate change.
By Joachim Seifert and Frank Lemke
Published: May 15, 2013 (15 pages) Full Paper 
Paywall: $20.00 |
media: image (1020 x 560 px) download |
|
Abstract We focus on one of the most important events in human history, the 4.2 kiloyear event, when great civilizations around the world collapsed
into anarchy and social chaos. From this moment on, climate cooling and widespread aridification began, lowering agricultural food production and human
living conditions. Various hypotheses exist about its cause; the most promising approach links the 4.2 kiloyear event to a cosmic asteroid crash into
Mesopotamia. The asteroid landed in a densely populated area; we examine at first major translations of preserved Sumerian documents on details and
progression of this catastrophic event. We quote major impact features as observed by historical Sumerian eyewitnesses. The impact, as a full strike,
eradicated the Imperial city of Akkad. The impact damaged all other Sumerian towns to different degrees. Based on our findings, we identify the location
of the missing city of Akkad. We analyze the onset of global cooling and severe aridification in the framework of our cosmic climate footprint analysis
for a selected 1,000 year timeframe. This footprint analysis of Holocene climate change affirms the occurrence and date of the impact event. We also
identify volcanic mega-eruptions, which are responsible for multi-decadal global temperature dips but which cannot cause centennial-long climate changes.
The footprint analysis takes 5 climate macroforcings into account and explains global cooling and aridification based on impact-related causes.
|
|
Five climate-forcing mechanisms govern 20,000 years of climate change.
By Joachim Seifert and Frank Lemke
Published: October 8, 2012 (18 pages) Explore Full Paper
Paywall: $20.00 |
media: image (1120 x 730 px) download |
|
Abstract We identify five macro-climatic mechanisms in our study that govern a long
time span of 20,000 years. The state of the art in climate-forcing mechanism analysis
is that presently available General Circulation Models (GCMs) underperform substantially
in terms of predictive power. It is evaluated in the literature that all GCMs perform
well for the first 500 years backwards from the present, but then lack skill for the
previous 9,500 Holocene years. It is critical for climate models, however, that they
also show their validity on time frames of more than 1,000 years.
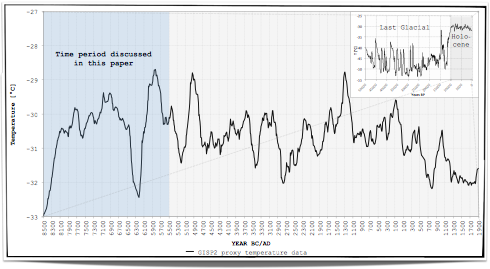
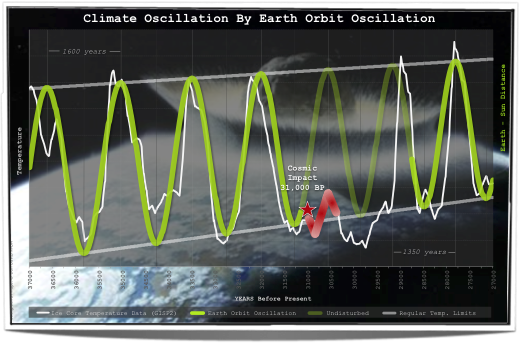
The presented climate-forcing study proceeds with the selection of 10,000 years of the entire Holocene interglacial and, for comparison, of another 10,000 years of a purely glacial time span (37,000-27,000 BP) from the GISP2 data. It considers the effects of Milankovitch cycles, atmospheric CO2-concentrations, Solar Inertial Motions (SIM), the retrograde tri-synodic Jupiter/Saturn cycle, and of two major mechanisms, the Earth Orbit Oscillation (EOO) and the Cosmic Impact Oscillation (CIO). Detailed mechanisms for both oscillations are provided; their calculation methods are pointed out. Concluding the study, we zoom in onto EOO and CIO forcing of the past 3,000 years and provide an outlook onto forcing mechanisms, which are expected to act within the future 500 years. The GISP2 proxy temperature curve and macro-forcing mechanisms are compared to the Hockey Stick temperature evolution pattern. Details of demonstrated astro-climatic relations are as of today, 2012, new and original climate change knowledge. The IPCC has not been able to provide supplementary data on cycle mechanics. The identification of 5 macro-climatic drivers, missing in current GCMs, unmistakably proves that climate science is not settled yet. One missing driver may be excused, but not five. The notion of "The science is settled", upheld since the days of Galileo, is a spiritual relict of the past. All GCMs will be rectified soon. |
|
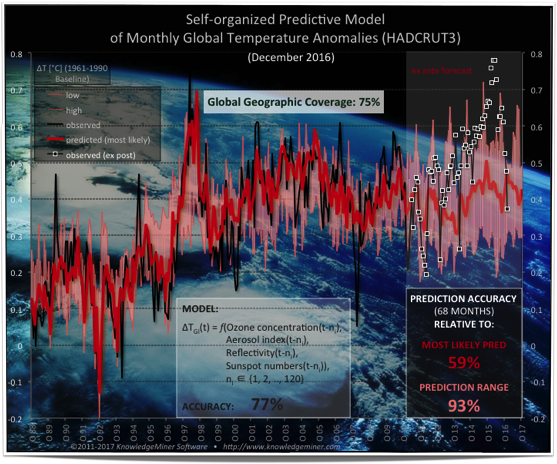
Ex ante Forecast of Monthly Global Temperatures until October 2017 by a Dynamic System Model.
The power of self-organizing knowledge mining applied to climate modeling.
Published: October 2011, observed data and prediction accuracy are updated periodically. (last update January 2017) Abstract This model describes a non-linear dynamic system of the atmosphere consisting of 5 variables: Ozone concentration, aerosol index,
radiative cloud fraction, and global mean temperature as endogenous variables and sun activity as exogenous variable of the system.
More...
|
|